Performance Clinic - Dynatrace Custom Service Metrics and Metrics API
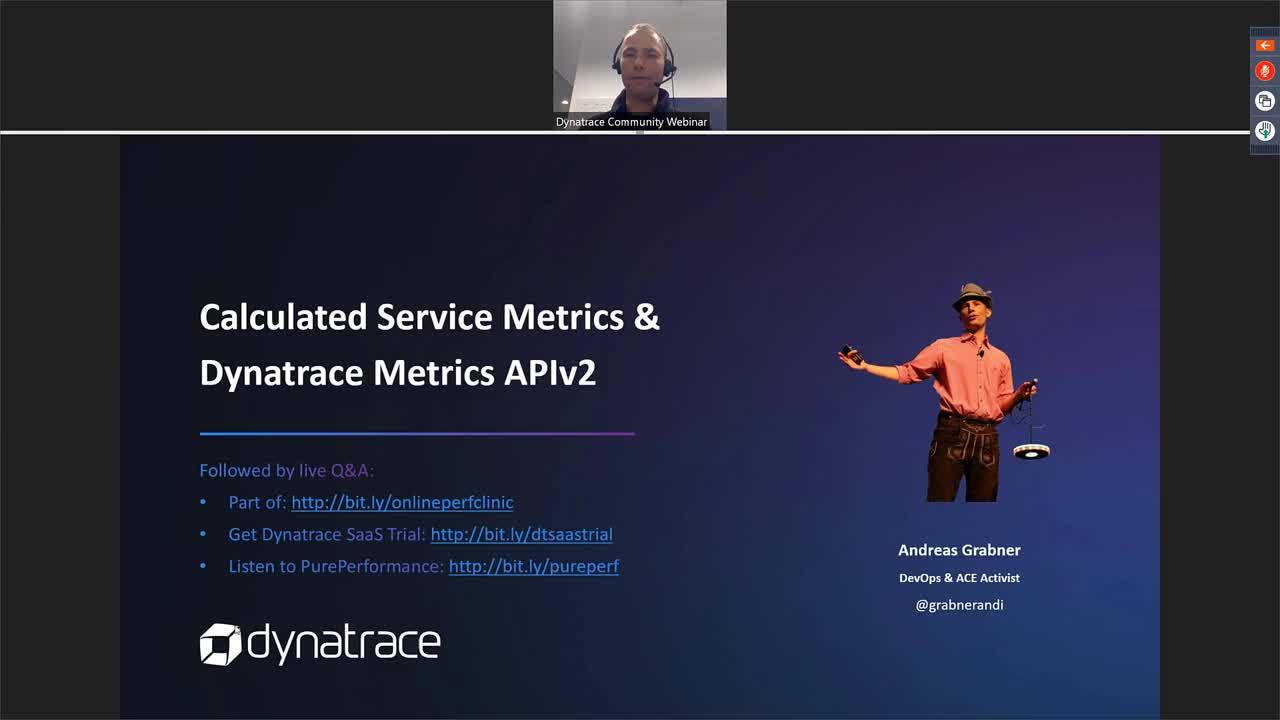
Custom Service Metrics allow you to answer questions like: What is the Throughput and Response Time of the Top 10 external API endpoints? Give me the number of database queries split by microservice endpoint! Or – What’s the Response Time for Search split by Product Category!
In this performance clinic, Andreas Grabner will show you how to configure custom service metrics, how to set up request attributes to allow splitting by custom business dimensions and how to leverage the new Metrics API to integrate these metrics into your DevOps toolchain.
Additional resources

See how leading enterprises are using real-time, contextual data to fuel trustworthy AI and drive transformation.
Learn more
Experience every boundary-breaking mainstage session, product announcement, and breakout session on-demand.
Register now
Gartner® has named Dynatrace a Leader in the 2025 Magic Quadrant™ for Observability Platforms for the 15th consecutive time, with the highest position for Ability to Execute.
Learn moreReady to see Dynatrace in action?
Get started now with Dynatrace SaaS or contact us for Dynatrace on-premises!
- Full stack availability and performance monitoring
- Smart analysis and alerting powered by artificial intelligence
- Deployable as SaaS, or keep your data on-premises
- Easy monitoring with no configuration
- Real-time support via in-product-chat
- Full scalability—scales with your needs
Try free trial Contact us